Debunking the Costs of Energy Code Compliance in Massachusetts: Construction and Delivery (Part 2)
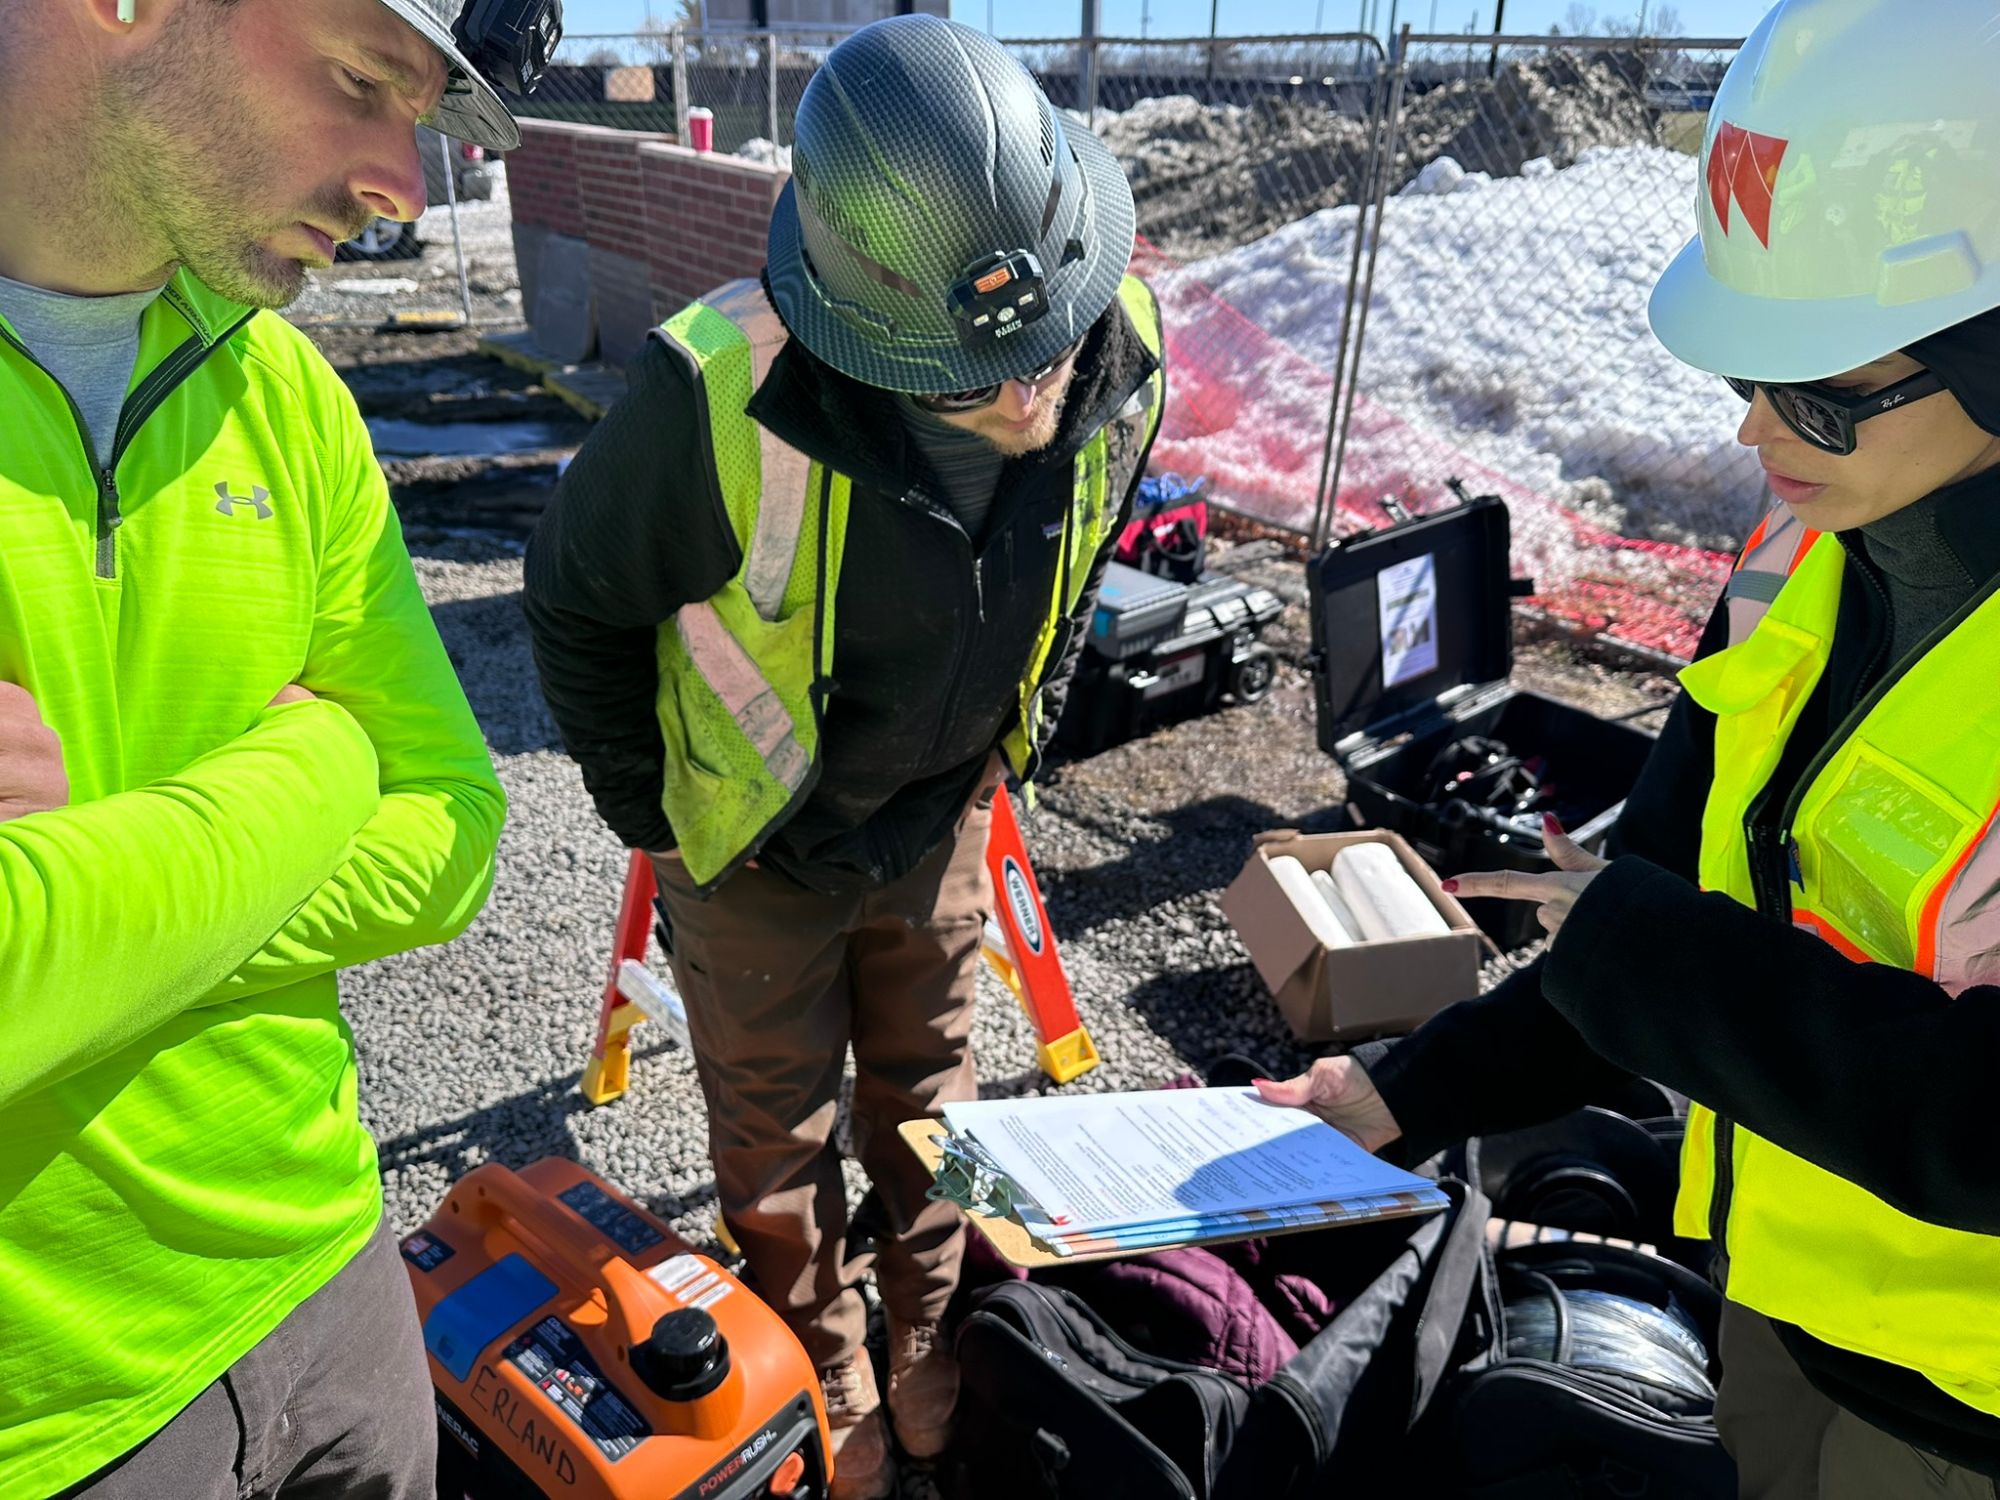
When projects move from design into construction, the cost conversation doesn’t get simpler—it gets less precise. Construction-phase cost pressure is rarely caused by a single requirement. It emerges from how design decisions, procurement timing, trade coordination, and field execution interact…
Read