

Research & Programs
Passive House design can result in efficient, cost-effective, comfortable, and resilient multifamily buildings—as long as it’s based on accurate data.
SWA has been modeling, designing, and advocating for Passive House (PH) multifamily (MF) buildings for decades, so to put our work to the test, we studied real-world performance data from a variety of MF buildings that have been occupied for several years—some designed to the PH standard, some not.
Our team used a combination of data sources:
Our findings uncovered a mix of validation and surprises, with implications for modeling accuracy, system sizing, and building resilience.
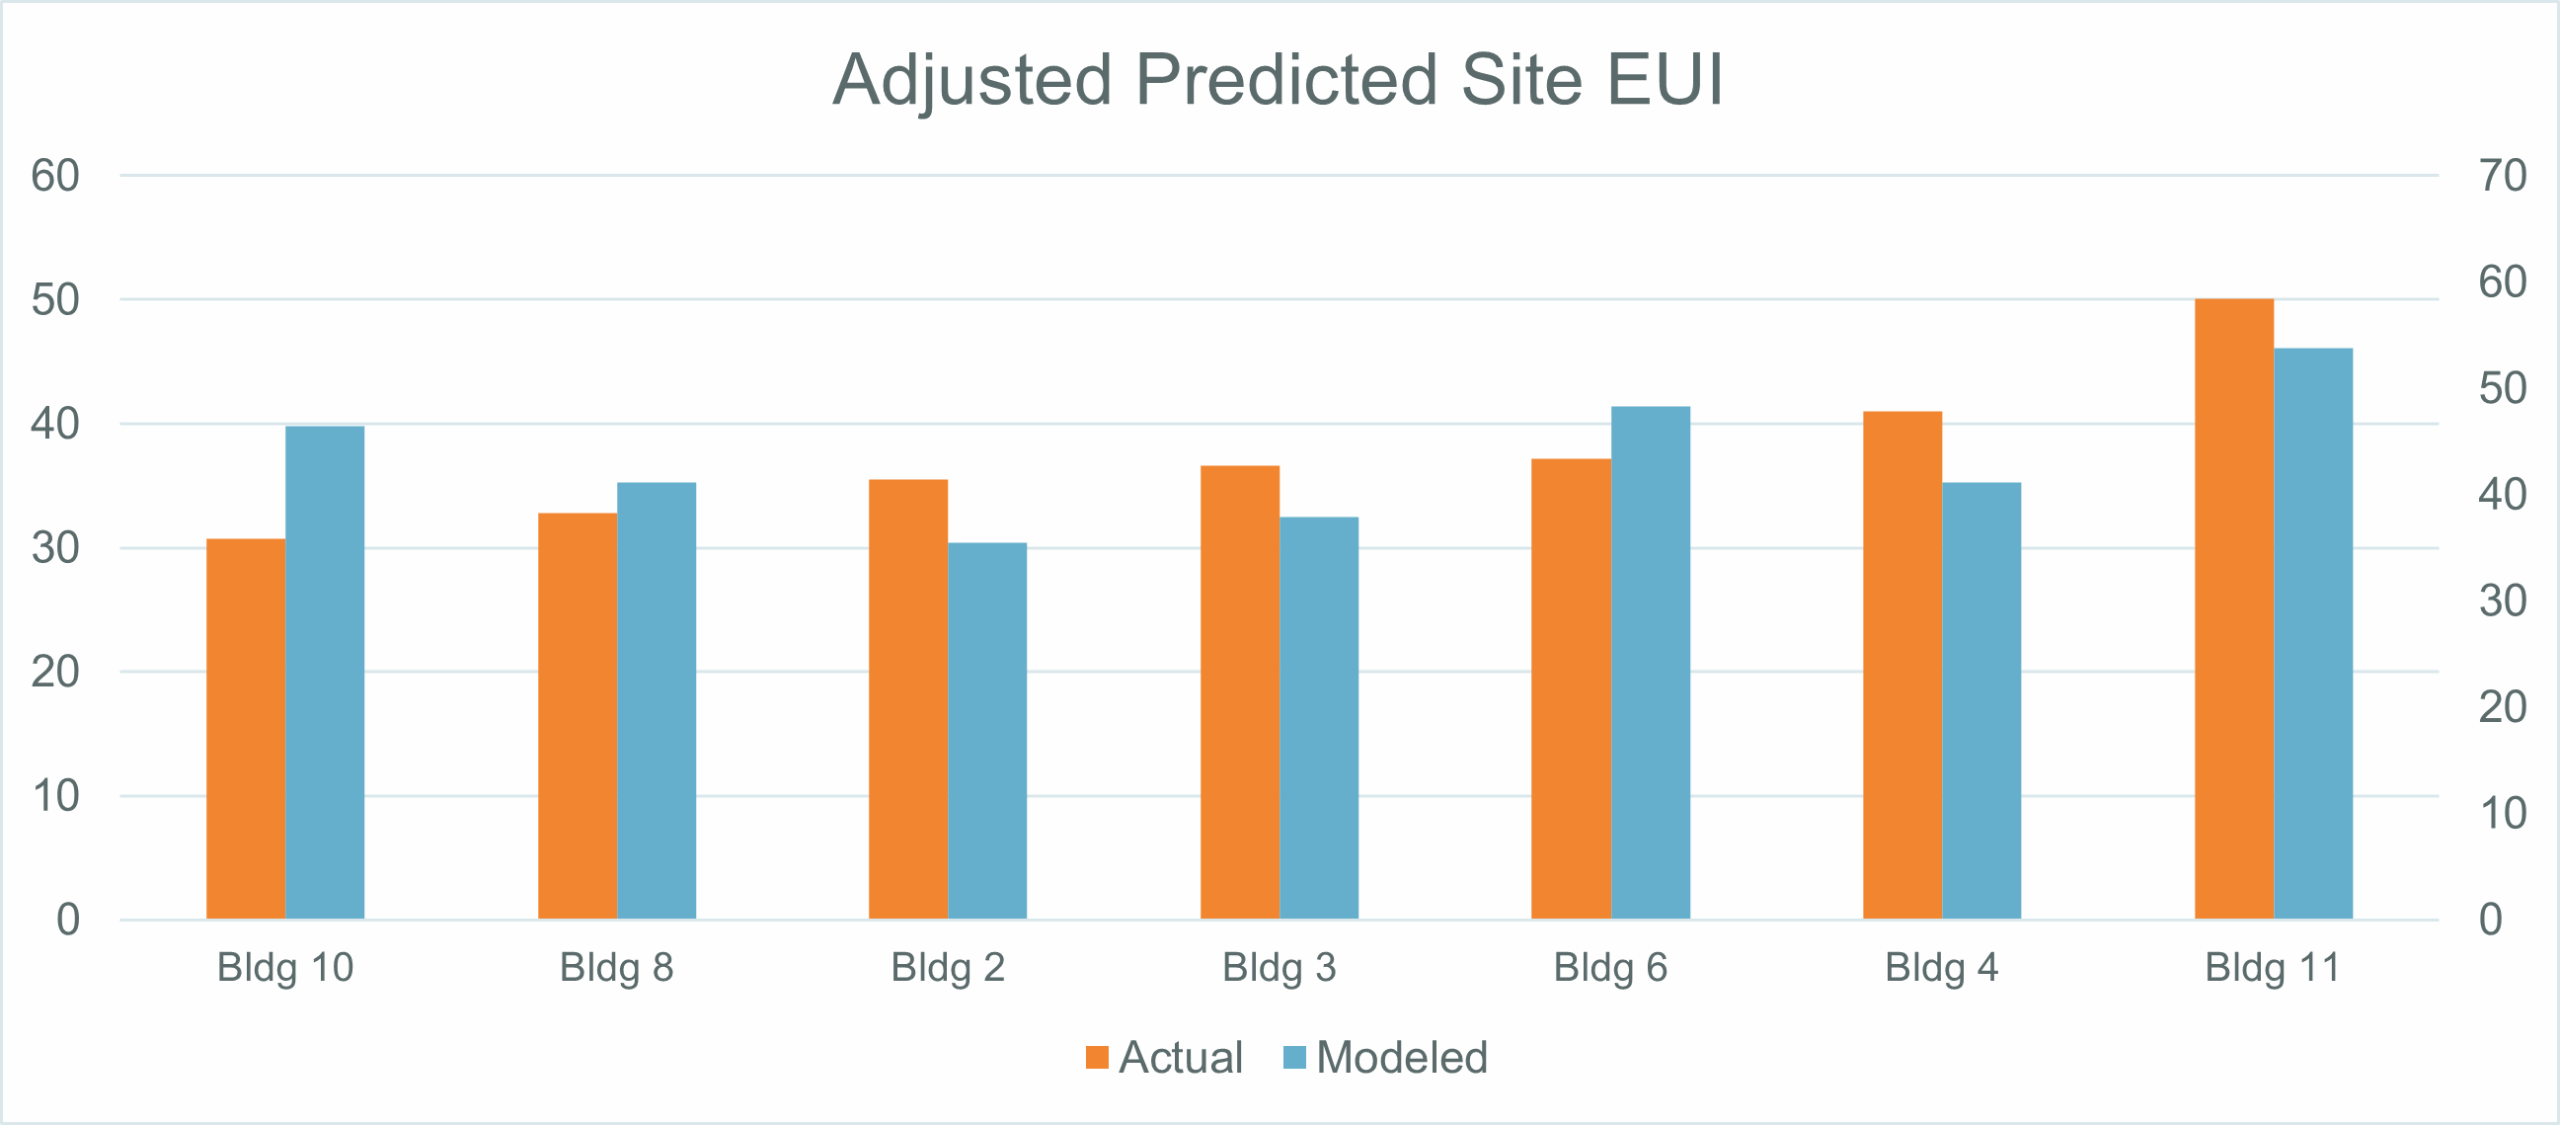
We compared predicted vs. actual whole building site energy use intensity (EUI) across seven PH projects for which SWA served as the certification consultant. Our analysis revealed that site energy use was 36-64% higher compared to the modeled predictions in the PH software used for certification.
Under-predicting whole building energy use can have many negative consequences in the design, construction, and operation of PH buildings, so it’s important to understand where the assumptions differ significantly from reality to reduce this margin of error.
When we compared our predictions to NYC MF building data, it became clear that real-world domestic hot water (DHW) use is much higher than we thought and is the primary culprit behind the modeling gap.
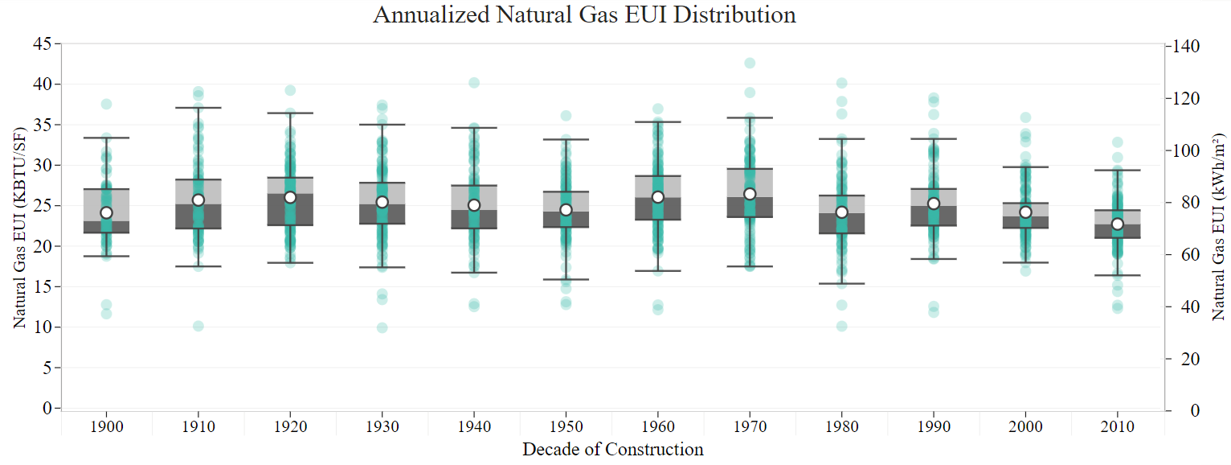
The following chart shows site EUIs from central DHW systems across 17,000 MF buildings in NYC. The gray boxes contain the middle 50th percentile, and the whiskers represent the upper and lower 25th percentiles. Other dots are outliers in the data.
The average site EUI for DHW falls in the low- to mid-20s kBtu/gsf.yr; that’s about three times more than the highest predicted values in the PH software models (~7.5 kBtu/gsf.yr).
The average for the lower 25th percentile, 15 kBtu/gsf.yr, is still double the highest predicted values. (You’ll also notice the lack of reduction in DHW energy use over more than a century.)
Underestimating energy loads from DHW—sometimes by three times less than actual loads—was leading to significant discrepancies in predicted vs. actual building performance.
Once we adjusted our assumptions for DHW using data we gathered from our MF projects in NYC, the average difference in predicted vs. actual site energy use dropped to an average of 14%.
All findings will be shared with US-based and international PH certifying bodies to advocate for changes to their modeling assumption.
We’re likely also under-predicting cooling loads, as DHW systems in these projects are typically central, recirculating systems that put off heat. Currently, we do not have data to quantify this effect.
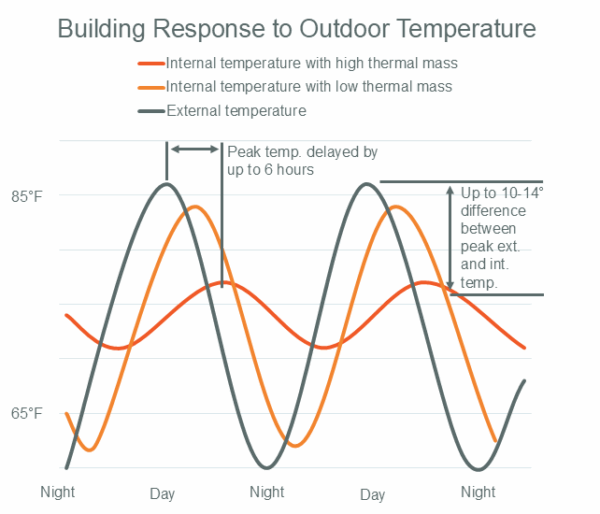
PH buildings have long been considered more comfortable, safe, and resilient because they barely respond to outdoor temperature similar to buildings that have high thermal mass. The lack of thermal bridging, the air-tight envelope, and continuous insulation result in a delayed response to the exterior temperature and weather conditions similar to high mass buildings along with reduced peak loads.
This graph illustrates how a building with high thermal mass should respond to the outdoor temperature.
Oversized HVAC systems are common in PH buildings, because they are sized for the “1% design temperature” (a.k.a. the peak cold temperature) when in reality, they can be safely sized using the daily average coldest temperatures. As part of our research, we looked at heating demand data to prove this.
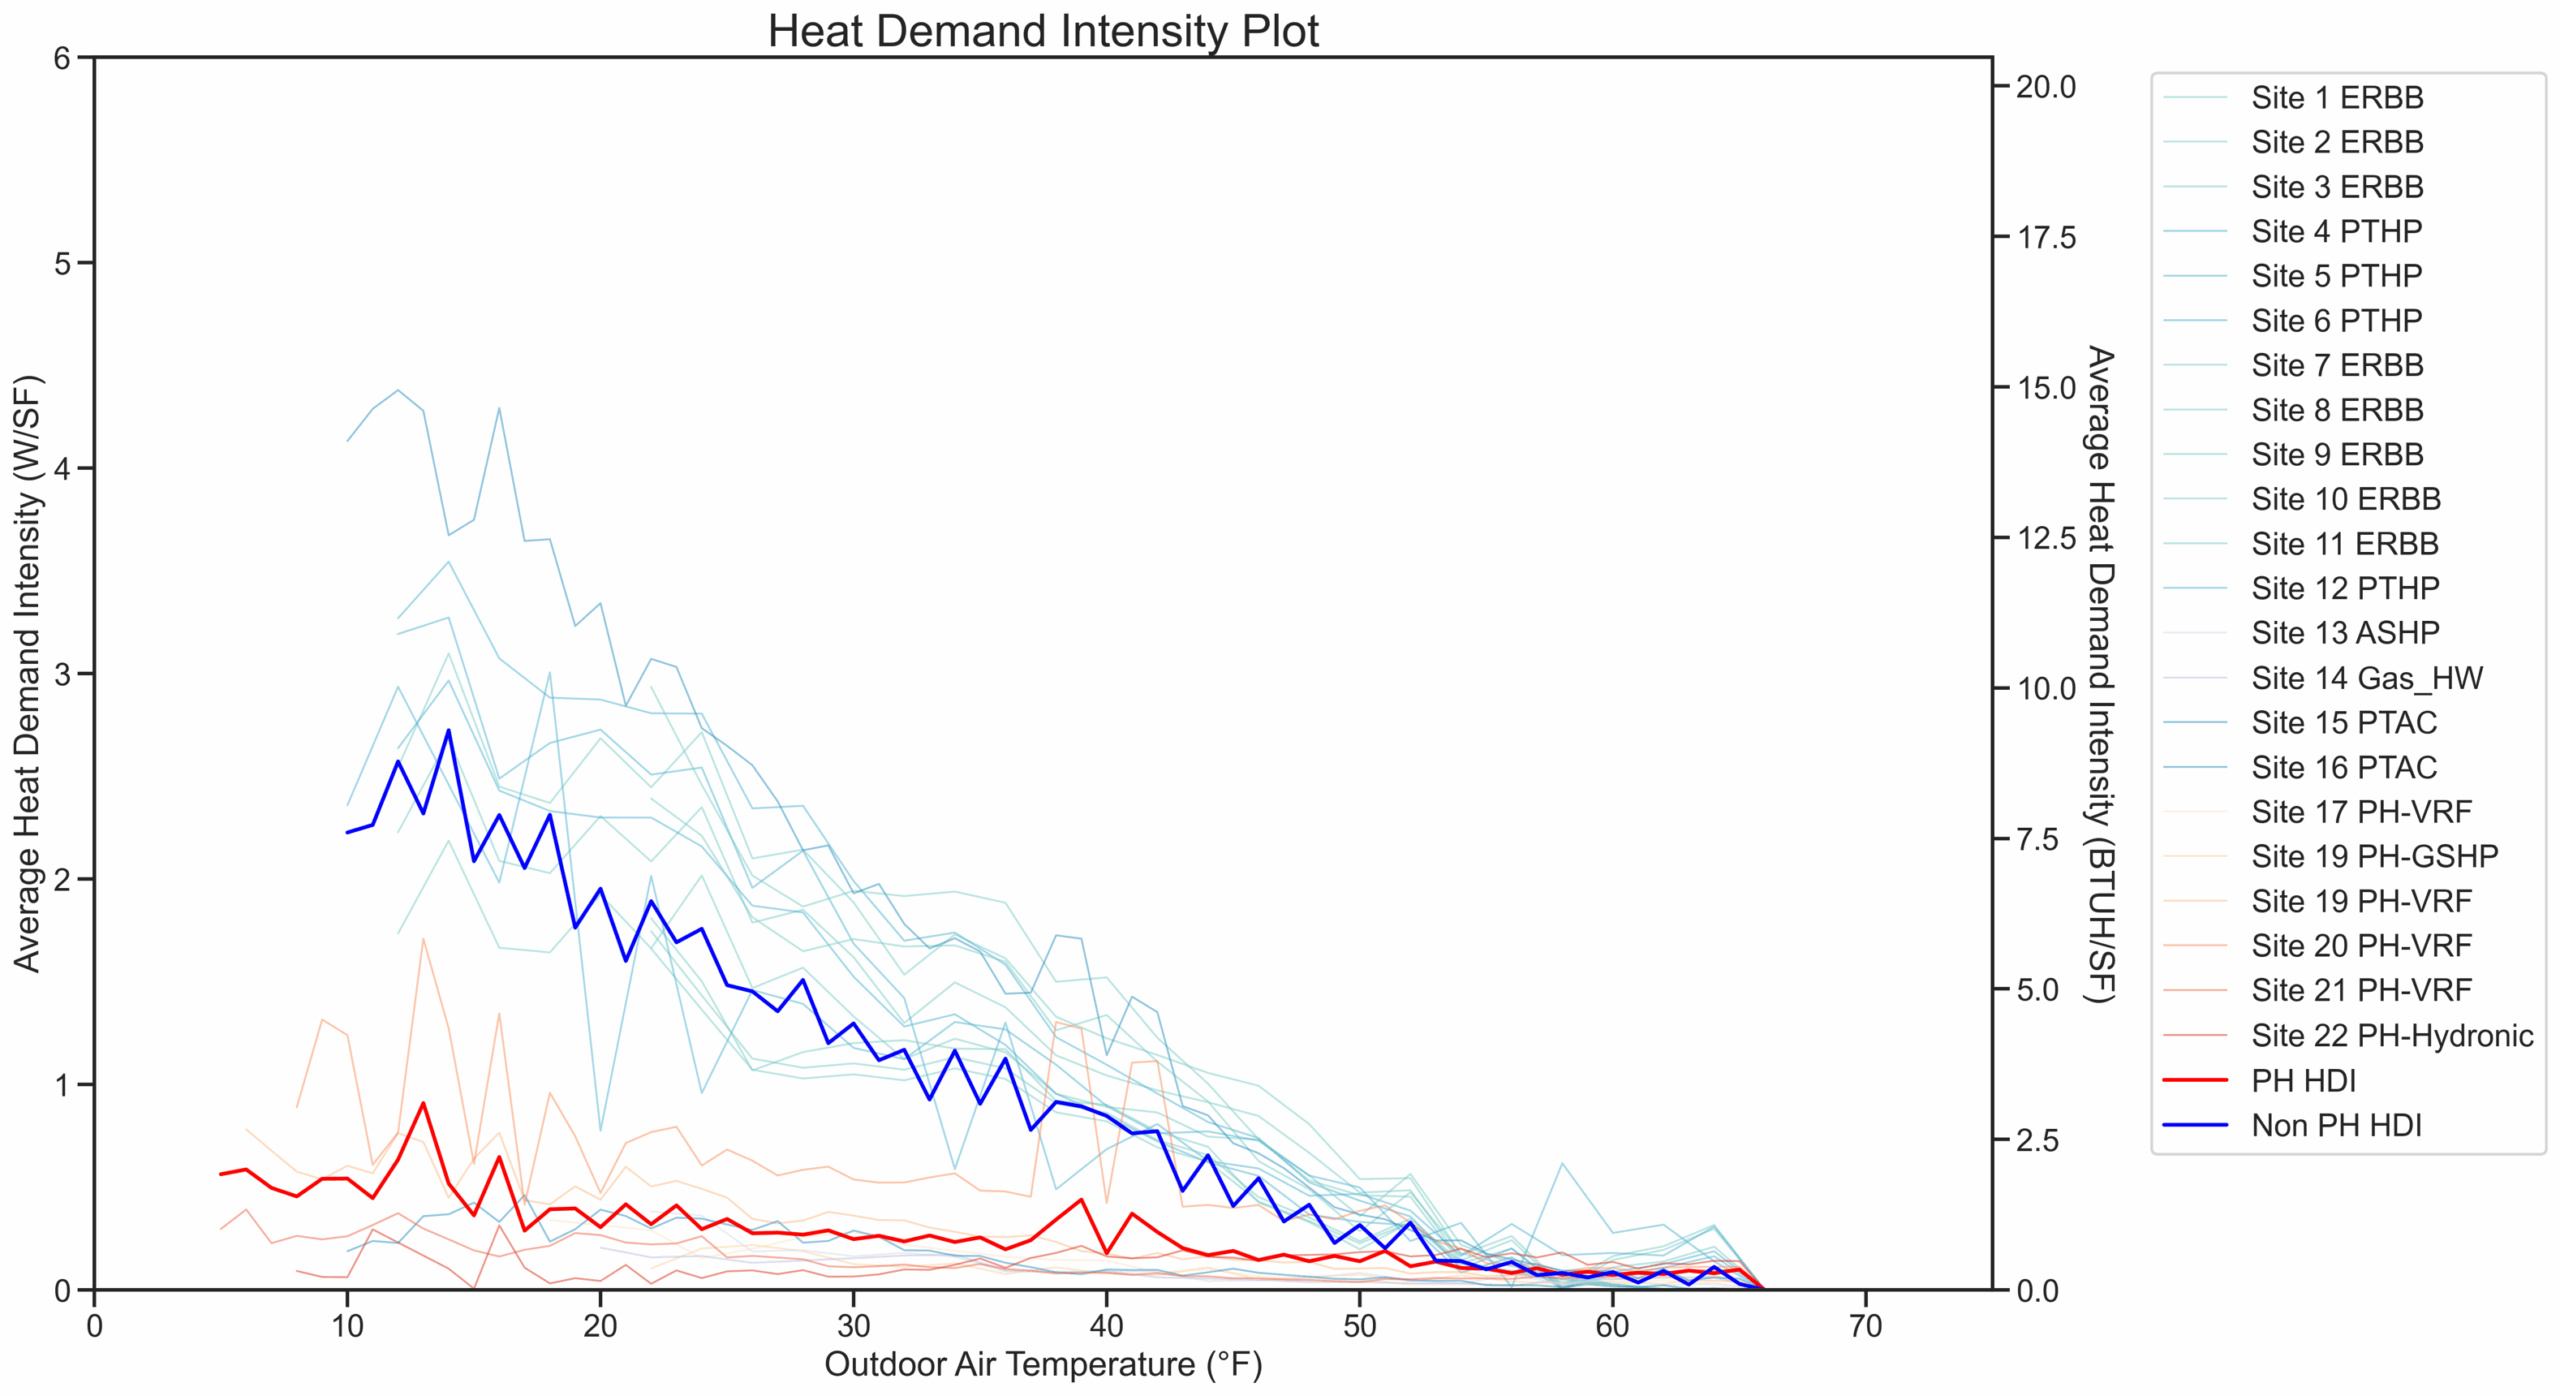
To demonstrate this same trend with real-life, operational building data, we took data from 22 PH and non-PH buildings in NYC. We compared 15-minute interval data showing peak heating demand with the corresponding outdoor air temperature at the time.
In the following chart, you can see that the peak heating demand in PH buildings remained stable across a range of outdoor temperatures, unlike conventional buildings which showed sharp increases.
This isn’t just a win for energy efficiency and cost effectiveness. During an extreme weather event or power outage, PH buildings can maintain stable indoor temperatures without backup power.
Across the board, all the data we studied confirms that PH design saves energy and costs in MF buildings.
Through our work with NYC buildings, we are in a unique position to compare MF buildings from the same developers but designed with and without PH. We saw significant energy savings between the two.
These two buildings were constructed on the same timeframe and are of similar scale, but the PH building uses 50% less energy:
These two buildings are both affordable MF housing from the same developer and are of similar scale, but the PH building uses 39% less energy:
In addition to energy savings, both of these PH buildings are set up to comply with NYC’s Local Law 97 climate mandate through 2030.