I’ll save the long-winded introduction and get straight to the facts. Based on New York City’s publicly available Local Law 84 (LL84) benchmarking data for 2015, hotels emit 32% more greenhouse gas (GHG) per square foot than the average for all buildings. I also want to qualify this by making a few statements about the data:
- There are 13,973 buildings on the Department of Finance list; of which 2,353 did not comply with LL84 or are not required to comply.
- We removed the outliers. Weather-normalized source energy use intensity (EUI) over 550 and under 100 (kBtu/ft2) typically indicates erroneous data. Most likely either the building’s benchmarking activities or report filed with NYC were completed incorrectly.
- A significant portion of the list comprises the buildings with erroneous data: 4950. Seems a little crazy, no? Leaving us with a good topic for another day….
- For clarity, that means we analyzed the remaining 6,654 buildings.
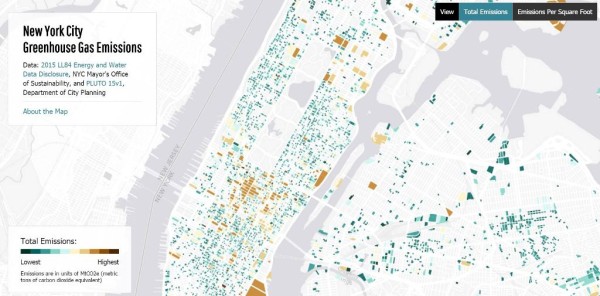
Click to View Interactive NYC GHG Emissions Map – via CityLab. Map credit: Jill Hubley
The good news – for the sake of this post – is that the hotel market had one of the higher rates of correctly reported compliance data. Out of 187 buildings, 143 reported with numbers that were in a normal range. The average for the sector however, reflects EUI and GHG emissions per square foot that are much higher than other similar building types. Multifamily buildings, for example, have an average of 42% lower GHG emissions/ft2 than hotels (see table below). (more…)